What Happened in the Stock Market on Friday, November 20, 2026
The S&P 500 fell 3.7% and Nvidia fell 14% on Friday, November 20, 2026. See what moved, when it moved and where the selling was concentrated.
Friday, November 20, 2026 was the worst day of a bad week for US stocks. The S&P 500 fell 3.7%, its seventh lower close in a row, and the Nasdaq Composite fell 5.3%. Nvidia lost 14% in one session after a report that the SEC is examining its accounting.
This post goes through the day in order: the index numbers, what set the selling off, the time it happened, and where the damage was and was not.
The numbers
| Index | Friday close | Change |
|---|---|---|
| S&P 500 | 6,910.39 | -3.70% |
| Nasdaq Composite | 22,617.73 | -5.28% |
| Dow Jones | 48,147.33 | -1.93% |
The ETFs that track them show the same picture, with the week added:
| ETF | Friday change | Week |
|---|---|---|
| SPY (S&P 500) | -3.64% | -8.56% |
| QQQ (Nasdaq-100) | -5.67% | -10.51% |
| DIA (Dow) | -1.98% | -8.04% |
| IWM (Russell 2000) | -2.88% | -7.54% |
SPY closed 11.5% below its record close of October 6, which puts the S&P 500 in a correction (a fall of 10% or more from the high). QQQ closed 19.9% below its October 6 close. At its low of the day it was 20.2% below, so it briefly crossed the 20% line that is usually called a bear market.
What set it off
The week was already weak, and most of the weakness was in stocks tied to AI spending. Nvidia had fallen every day since November 12.
On Friday, Reuters reported that SEC enforcement staff are examining possible accounting issues at Nvidia, citing two people briefed on the matter. The Wall Street Journal had reported earlier in the week that the SEC was investigating the company without saying what the investigation was about. According to coverage of the Reuters report, it did not say which accounting practices are under review, and the SEC has not announced any action. That is all that is public, and it is worth keeping the report and the facts apart: an examination is not a finding.
Nvidia closed at 125.53, down 14.01% on the day and 22.9% on the week. Its last 10-Q lists 24.1 billion shares outstanding as of August 21, so a fall of 20.45 dollars a share is about 493 billion dollars of market value in one session.
When it happened
The timing matters, because the day had two separate parts.
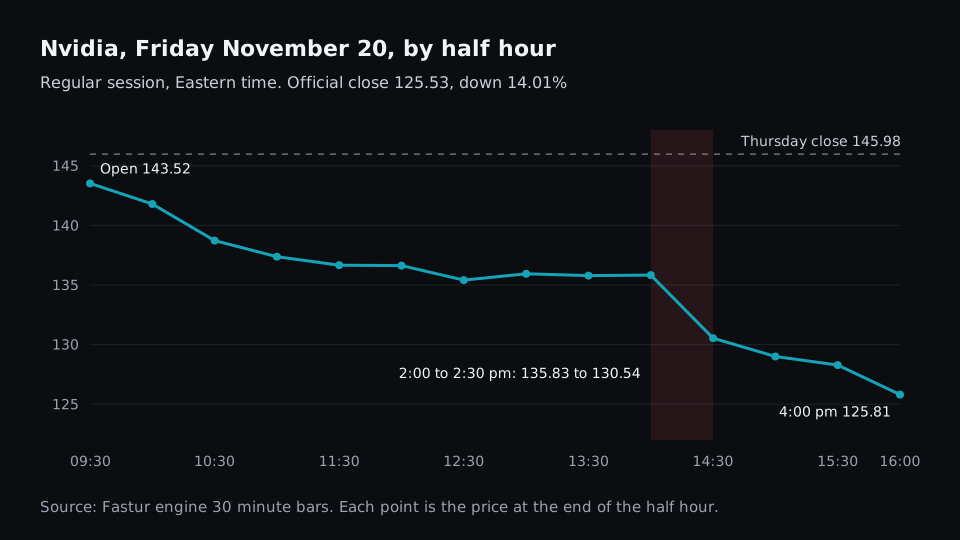
From the open until 2:00 pm, Nvidia slid steadily and then went flat. At 2:00 pm it was at 135.83, about 7% below Thursday's close. In the next half hour it fell to 130.54, and it kept falling into the close. The low of the day, 124.50, came in the last half hour.
The whole market followed the same shape. SPY was near 700 at 1:30 pm, broke lower in the 2:00 pm half hour and made its low of 686.75 in the final 30 minutes, 4.1% below Thursday's close. That last half hour traded 30.9 million SPY shares, more than twice any other half hour of the session.
A day that falls in the morning and holds is a different day from one that makes its low at 3:55 pm. Friday was the second kind. Sellers were still active at the bell.
Where the selling was
It was concentrated in semiconductors and the largest technology companies.
| Stock or ETF | Friday change | Volume vs 20-day average |
|---|---|---|
| Nvidia (NVDA) | -14.01% | 2.45x |
| Micron (MU) | -13.89% | 1.86x |
| AMD | -13.25% | 1.78x |
| Broadcom (AVGO) | -12.19% | 2.13x |
| Semiconductor ETF (SMH) | -10.60% | 2.03x |
| Taiwan Semi (TSM) | -9.48% | 2.39x |
| Oracle (ORCL) | -8.48% | 1.17x |
| Tesla (TSLA) | -7.64% | 1.28x |
| Meta (META) | -5.93% | 1.22x |
| Amazon (AMZN) | -4.10% | 1.47x |
| Microsoft (MSFT) | -2.77% | 1.67x |
| Apple (AAPL) | -1.90% | 1.70x |
The semiconductor ETF is now 40% below its closing high of June 22.
The sector ETFs show how narrow the worst of it was.
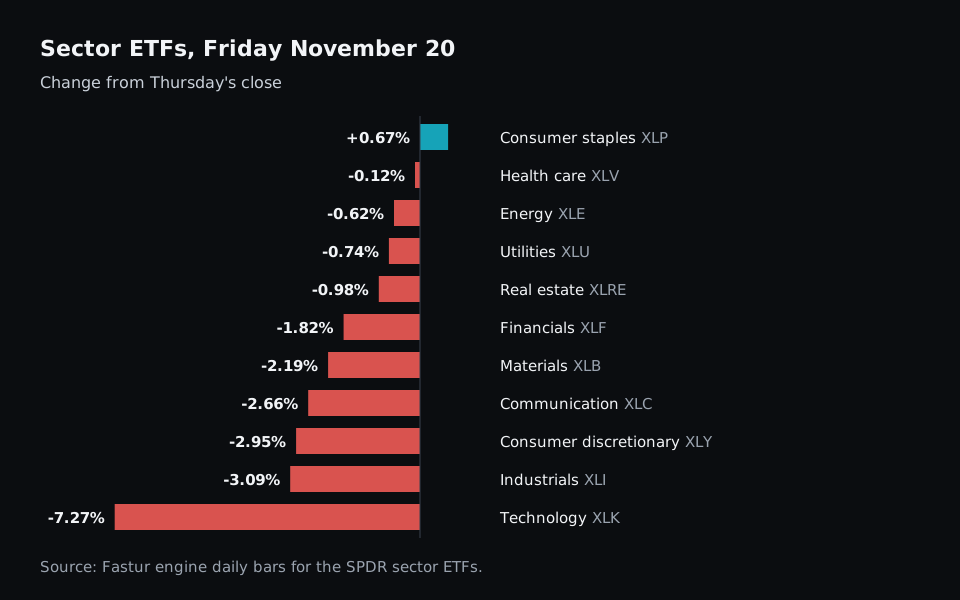
Technology fell 7.27%. The next worst sector, industrials, fell 3.09%. Health care was almost flat and consumer staples rose.
The index fell more than the average stock
The S&P 500 is weighted by company size, so a handful of very large technology companies carry a large share of it. The equal-weight version of the same index gives every company the same weight.
On Friday SPY fell 3.64% and the equal-weight ETF, RSP, fell 1.98%. The gap between those two numbers is the effect of the largest stocks. The typical company in the index had a bad day. The index had a much worse one because of what it holds the most of.
This is useful to check on any large down day. If the two numbers are close, the selling is broad. If the size-weighted index is far worse, as it was on Friday, the selling is concentrated in the biggest names.
Where money went
- Consumer staples were the only sector up. Walmart rose 1.52%, PepsiCo 1.11%, Coca-Cola 0.94% and Procter & Gamble 0.91%.
- Long Treasury bonds rose. TLT gained 1.37%.
- Gold fell. GLD lost 3.67% on 2.45 times its average volume. On a day when people sell what they can to raise cash, gold is often one of the things sold.
- Volatility products jumped. VXX rose 14.6%.
Volume
SPY traded 151.8 million shares, about twice Thursday's volume. QQQ traded 134.7 million shares, the most of any day in the 300 sessions of history the engine holds, which go back to September 2025.
Heavy volume on a down day tells you the move had broad participation. It does not tell you whether the selling is finished.
Anthropic's second day
Anthropic (ANT) began trading on Thursday after pricing its IPO at 83 dollars a share. It opened at 111.50 and closed its first day at 97.17. On Friday it fell 8.50% to 88.91, which is still 7.1% above the IPO price. A new AI listing had its second day in the middle of an AI selloff, so its first week will not say much about how it trades in a normal market.
How to read a day like this in a scanner
On a day when almost everything is red, a list of the biggest losers is not very useful. It is several hundred names long and most of them are down because the market is down. A few more specific questions narrow it:
- Who fell on heavy volume, and who just drifted? A stock down 6% on normal volume moved with the market. A stock down 6% on three times its normal volume had sellers of its own.
- Who closed at the low? A close in the bottom of the day's range means selling continued to the bell. A close well off the low means buyers showed up.
- Who was green? On Friday that list was short, which makes it worth reading in full.
- Who held up for most of the day and broke only after 2:00 pm? Those stocks were sold because of the afternoon news, not the morning's drift.
The first question takes two lines in Fastur. This is a fragment, checked against the engine:
RelVolDay = d1.volume / d1.volume[1:20].mean
logicblock HeavySelling = d1.close < d1.close[1] * 0.95 and RelVolDay > 2
RelVolDay is today's volume divided by the average of the 20 days before. HeavySelling is true for a stock that is more than 5% below yesterday's close on more than twice its usual volume. Our post on relative volume explains why the definition of "usual" matters, and the post on the order of events covers the "held up, then broke" case.
The week ahead
Next week is short. US markets are closed on Thursday, November 26 for Thanksgiving and close early on Friday. Volume is usually lower in a holiday week, and lower volume can make moves in either direction larger than the news behind them.
Nothing here is a forecast. The things that are known are narrow: the S&P 500 has closed lower seven days in a row, the selling has been concentrated in semiconductors and the largest technology stocks, Friday's low came at the end of the day, and the reason for the afternoon leg is a report about an examination whose details are not public.
This post describes what happened. It is not investment advice.
