What Is Relative Volume (RVOL)? Three Ways Scanners Calculate It
Relative volume compares current volume with normal volume, but scanners define normal in different ways. See the three common formulas and how to read each.
Relative volume, often written RVOL, is one of the most used numbers in a stock scanner. It tells you whether a stock is trading more than it normally does. A reading of 2 means twice the normal volume, and most day traders will not look at a mover without it.
The catch is the word "normal". Scanners do not agree on what it means, so the same stock at the same minute can show a relative volume of 0.27 on one platform and 3.0 on another. This post explains what relative volume measures, the three common ways it is calculated, and how to tell which one you are looking at.
What is relative volume?
Relative volume is a ratio:
relative volume = current volume ÷ normal volume
- 1.0 means the stock is trading its normal volume.
- 2.0 means twice normal.
- 0.5 means half.
The point of the ratio is to make stocks comparable. Four million shares is a slow day for a large company and an extraordinary one for a small one. Raw volume cannot tell you which, and relative volume can.
Traders use it as a sign that something has changed. A stock moving 5% on normal volume may only be drifting. The same move on four times normal volume means many more participants than usual are involved, which usually points to news, earnings or a level that a lot of people were watching.
Why the definition of "normal" matters
To see why, look at how volume behaves on an ordinary day. It is not spread evenly. Trading is heaviest just after the open and just before the close, and quiet around midday. This U shape has been documented in market research for decades, and you can see it on any intraday volume chart.
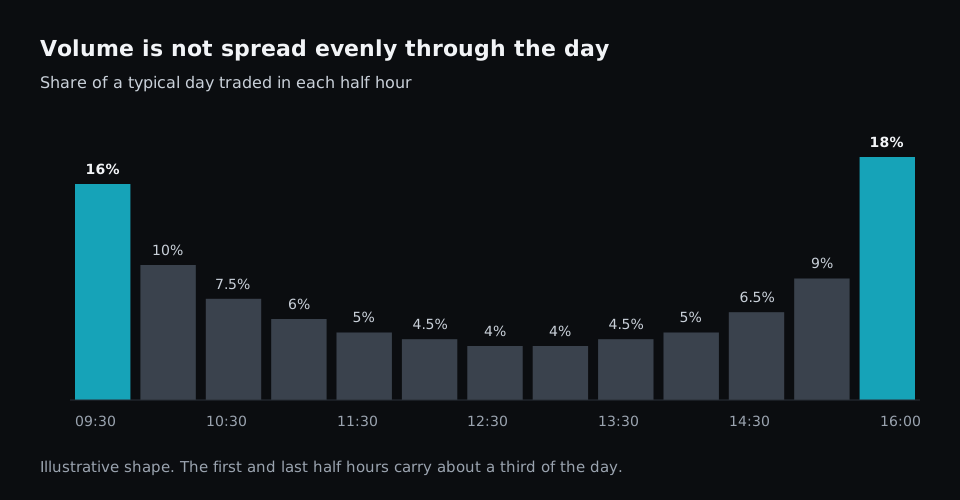
The exact percentages differ from stock to stock, and the chart above is illustrative. The shape is what matters: a stock that is behaving normally trades far more shares at 09:35 than at 12:35. Any definition of "normal" has to deal with that, and each of the three below deals with it differently.
Three ways scanners calculate relative volume
1. Today's volume against a full day's average
The simplest version divides the volume traded so far today by the average volume of a full day, usually over the last 20 days to 3 months. Finviz describes its relative volume this way: current volume divided by the 3-month average.
It is easy to compute and easy to understand. Its weakness is that it compares part of a day with a whole day. At 10:00 the stock has had 30 minutes to trade and is being measured against six and a half hours. On a normal day the reading starts near zero and only reaches 1.0 at the close.
2. Today's volume against the usual volume by this time
The second version compares like with like. It takes the volume traded so far today and divides it by the volume the stock has usually traded by this same time of day. Trade Ideas defines its relative volume this way, and TradingView offers a "relative volume at time" measure that works on the same idea.
With this version a reading of 1.0 means normal at any time of day, and 2.0 at 09:45 means the same thing as 2.0 at 14:00. It needs more data, because the scanner has to keep the intraday history of every stock, not only the daily totals.
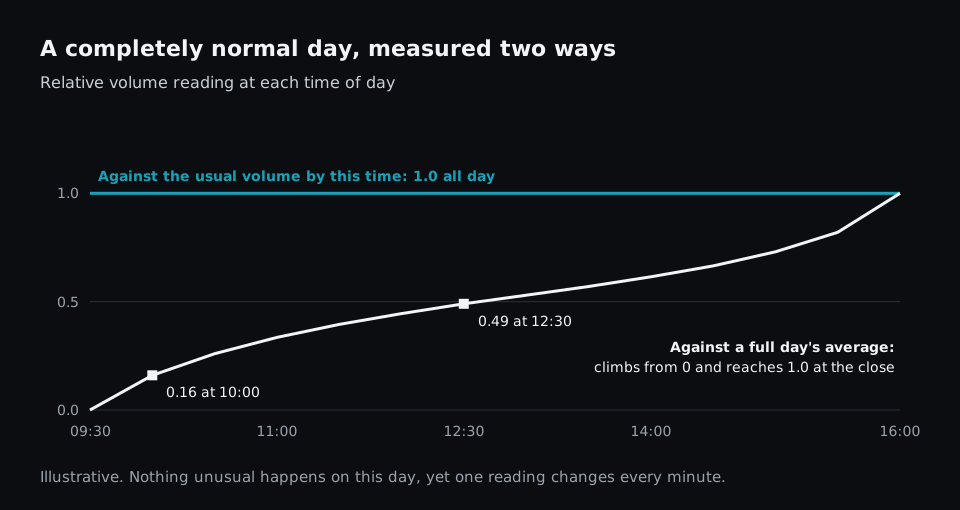
The chart shows a day on which nothing unusual happens. One definition says 1.0 all day. The other reads 0.16 at 10:00 and 0.49 at 12:30, even though the stock is doing exactly what it always does.
3. A recent bar against the bars before it
The third version ignores the day as a whole. It compares the volume of a recent bar, such as the last 5 minutes, with the average of the bars just before it. This is often called a volume spike or volume burst.
It answers a different question: is this stock busy right now compared with a few minutes ago? That makes it the fastest of the three to react. Its weakness is the U shape again. The first bars after the open and the last bars before the close are always heavier than the bars around them, so a burst reading near 09:30 or 15:50 is less meaningful than the same reading at noon.
The same stock, two different readings
Take one stock at 09:45. It has traded 2.7 million shares. Its average full day is 10 million shares, and by 09:45 it has usually traded about 0.9 million.
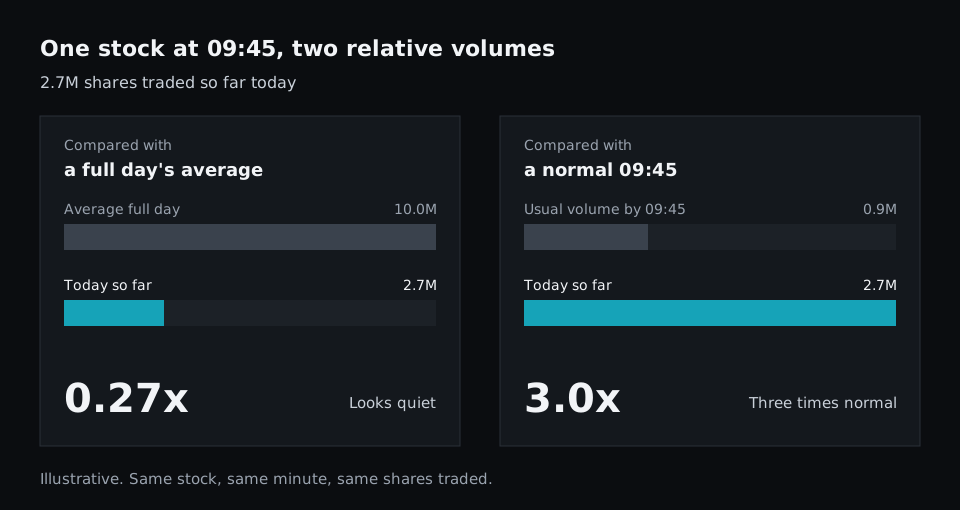
Against the full-day average the reading is 0.27, which looks like a quiet stock. Against the usual volume by 09:45 it is 3.0, which is a stock trading three times its normal pace. Both numbers are correct. They are answers to different questions, shown under the same column name.
This is why a threshold does not travel between platforms. "Relative volume above 2" is a strict filter at 09:45 under the first definition and an ordinary one under the second. We covered the wider version of this problem in the problem with preset stock scanners.
What is a good relative volume?
It depends on the definition, so the table gives a reading of 2.0 under each one.
| Definition | What 2.0 means | Best used |
|---|---|---|
| Today vs a full day's average | The stock has already traded two full days of volume. Very strong early, less so near the close | Late in the session and after the close |
| Today vs the usual by this time | Twice the normal pace for this time of day | Any time during the session |
| Recent bar vs earlier bars | The last few minutes were twice as busy as the ones before | Timing an entry on a stock you already watch |
As a rough guide for the time-of-day version, many intraday traders treat 1.5 to 2 as elevated and 3 or more as unusual. Treat those as starting points to test against your own setups, not as rules.
Common mistakes with relative volume
Using a full-day reading in the first hour. Under the first definition almost every stock reads below 1.0 in the morning. A filter of "above 2" at 09:45 will return very few stocks, and they will be extreme cases.
Ignoring the size of the base. A stock that averages 40,000 shares a day shows a relative volume of 10 after trading 400,000. It is unusual for that stock and still hard to trade. Pair relative volume with a floor on actual volume or dollar volume.
Forgetting what is in the average. An earnings day or a news day inside the lookback period raises the average and lowers every reading after it. A short lookback reacts faster to this, and a long one is steadier.
Not knowing whether premarket counts. Some platforms include premarket volume in "today so far" and some start at 09:30. A stock with a heavy premarket can look very different between the two.
Reading a burst at the open as a signal. The first minutes after 09:30 are heavier than the minutes before them for nearly every stock. That is the U shape, not unusual interest.
How to check which definition your scanner uses
The help pages are the first place to look. If they do not say, you can find out in one session:
- Pick a large, steady stock on a day with no news.
- Note its relative volume at 09:45, 12:30 and 15:45.
- If the reading climbs through the day and ends near 1.0, the scanner is comparing with a full day's average.
- If it stays close to 1.0 the whole time, it is comparing with the usual volume by that time of day.
How to write relative volume in Fastur
In Fastur the definition is not hidden behind a column name, because you write it. d1.volume is today's volume so far, and a window such as [1:20] covers the 20 days before today. The full-day version and a burst condition look like this:
RelVolDay = d1.volume / d1.volume[1:20].mean
logicblock VolumeBurst = m5.volume[1] > m5.volume[2:13].mean * 3
RelVolDay is today's volume divided by the 20-day average, and you can show it as a column or use it in a condition. VolumeBurst is true when the last completed 5-minute bar traded more than three times the average of the 12 bars before it. Change the 20, the 12 or the 3 and the definition changes with it, in plain sight.
You can also ask the assistant in plain English, such as "add relative volume as a column", and then read the line it writes to see which definition you got. The scripting docs list the timeframes and windows available, and our post on time-based conditions explains rolling windows in more detail.
To try the three definitions on your own numbers, use the relative volume calculator. The relative volume scan guide walks through writing the scan itself.
The takeaway
Relative volume is current volume divided by normal volume, and "normal" has at least three meanings: a full day's average, the usual volume by this time of day, or the bars just before now. The first is simple and misleading early in the session. The second is comparable all day. The third is the quickest and the noisiest. Before you set a threshold, find out which one your scanner shows, and pair it with a floor on real volume. For the wider checklist, see the essential features of a modern stock scanner.
